Java Dependency Management and Impact Analysis with CodeLogic
Overview
Java: The Backbone of Modern Business Operations
Enterprise-level Java deployments are often foundational to business infrastructures. Several factors contribute to this ubiquity:
- Stability and depth of the Java language
- Wide array of development libraries
- Application frameworks with sensible defaults, like Spring, Grails, Vaadin, Struts, Spark, and others
- Efficient java database integrations via JDBC
- Robust and performant data streaming/messaging frameworks such as Apache Kafka, Rabbit MQ, Java Messaging Service and Jakarta
Challenges in Managing Java Dependencies at Scale
-
Loss of original developers or documentation for older business rules
-
Missing inter-application dependencies in Java IDEs
-
Lack of code-level transparency in closed-source frameworks
-
Difficulty in predicting the impact of Java code changes due to complex systems
In short, it is extremely complicated to see all interconnections and all endpoints across all Java applications, classes, and methods within a single business. It’s even more difficult to know with certainty what code changes may produce regressions.
Integrating Software Intelligence in Java Development
Software Intelligence tools evolved as solutions for the problems above. These tools tend to access your application environment through either a top-down or bottom-up approach.
Top-down software intelligence tools
Top-down planning and monitoring tools provide data and guidance for your entire application environment. Some of the questions these top-down tools answer are:
- How do all the applications fit together?
- Which parts of the digital infrastructure are ripe for transformation to microservices?
- Which applications are the performance bottlenecks?
Application monitoring tools (APMs) also provide top-down perspectives of how data is moving through all your databases and Java applications.
Because of their high-level view, top-down software intelligence tools are fantastic for architects and SREs alike: they help understand how the whole picture fits together and represent where the potential fault points are in your Java applications and information workflows.
For example, you may have a distributed Grails application running on the Spring Boot framework utilizing FusionAuth authentication, all drawing from multiple SQL databases via JDBC connections. The top-down approach shows what connections are made between each framework, database, or sub-application.
Java Software Intelligence
Bottom-up software intelligence tools
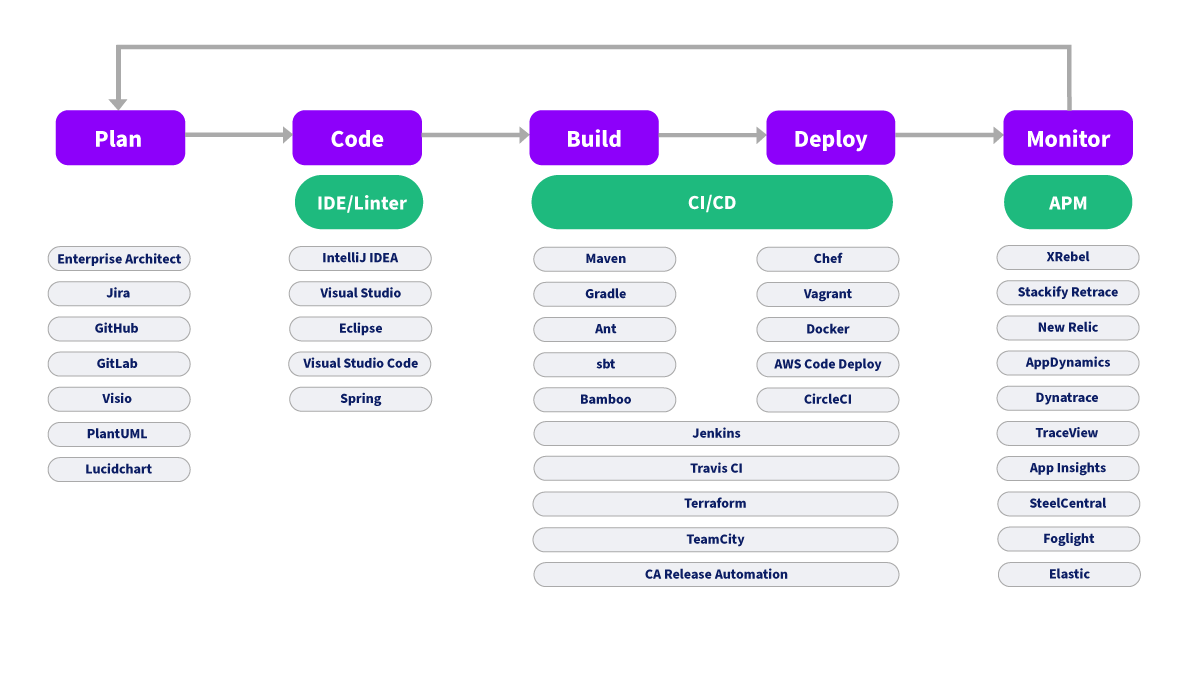
Many software intelligence tools gather data at the code or repository level, often integrating directly with IDEs or GitHub. Source-code scans are adept at gathering highly localized, code and project-specific details. These rudimentary scans can also be triggered through your build or deployment phases through Maven, Gradle and Ant plugins or activated as part of your CI/CD pipeline through Jenkins, Travis CI, Terraform and others. The assembled relationship data, however, is limited to the domain of the project itself, yet provides additional features like code-linting, code quality analysis and code-styling.
In both cases, the focus is on one level of visibility: ground-level source code or 30,000-foot architectural overview. What’s obscure in both cases are the relationships between the code and a multi-application ecosystem.
Next-generation Java Continuous Software Intelligence
Continuous Scanning for Real-Time Insights
CodeLogic’s platform continually scans your Java applications and JDBC databases:
- Real-time Java dependency graphs
- The ability to perform deep impact analysis to understand the implications of code changes large and small
Java Continuous Software Intelligence
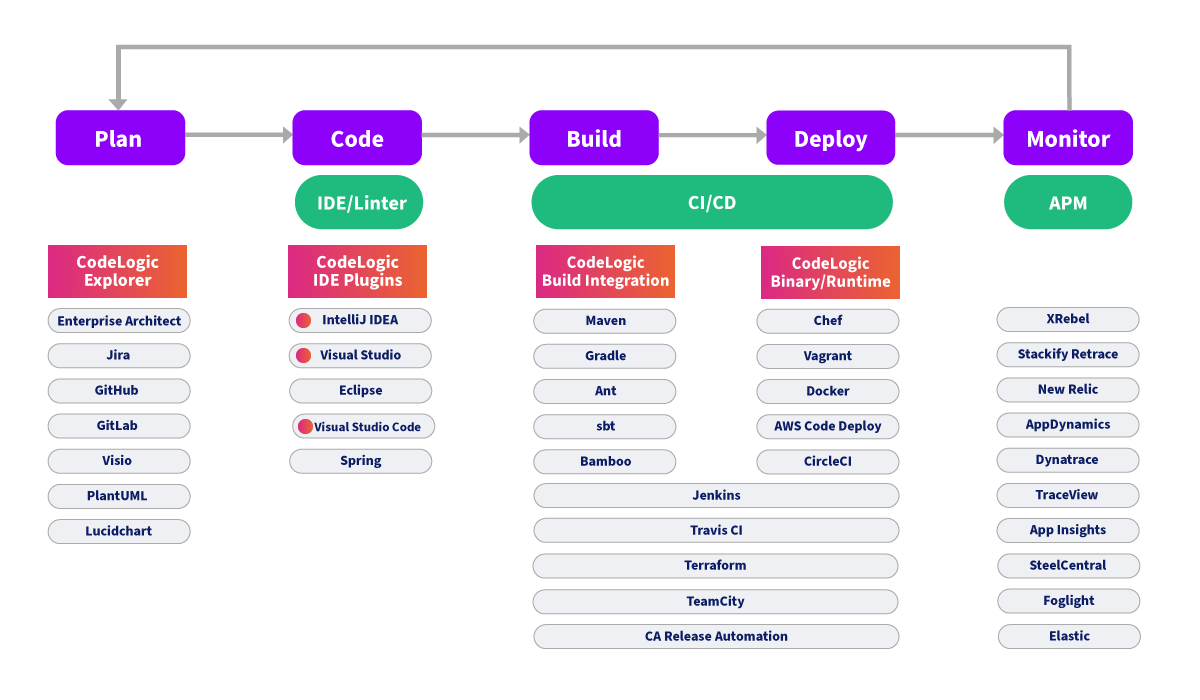
The CodeLogic Continuous Software Intelligence Platform enables both top-down and bottom-up approaches to software system analysis and provides a continuous spectrum of relationship data everywhere in between. Finally, a solution exists showing inter-application relationships, across projects, databases and microservices.
Get started with CodeLogic